Bitcoin and Ethereum correlation to US equities
Bitcoin and Ethereum correlation to US equities
When US stocks go up, so does the price of Bitcoin and Ethereum. When US stocks go down, Bitcoin and Ethereum price follows. Why?

Dear frontrunners,
Have you noticed:
When the price of US equities (SPY, QQQ) goes up, crypto assets like Bitcoin, Ethereum, and Solana also go up.
When US equity prices go down, crypto prices follow.
Is this a coincidence?
Is there a statistically significant correlation between the performance of US equities vs Bitcoin and Ethereum?
Are the narratives around crypto as sound money and a hedge against fiat debasement …just that: narratives?
In this brief analysis, we explore the correlation in price action between US equities and Bitcoin + Ethereum. Note I am a crypto enthusiast. I operate a bitcoin mining rig and an Ethereum node. I believe that Ethereum will eventually become the global settlement layer of the next generation of financial systems. I believe in bitcoin’s potential to act as an eventual store of value and peer-to-peer payments system but I also acknowledge that, for now, Bitcoin is currently highly correlated to the performance of the S&P500 and broader US equities market. For clarity, I am not stating that rising equity prices are causing crypto assets like bitcoin to rise. It is being stated that crypto assets behave like high-beta tech stocks: high volatility with a high correlation to the market.
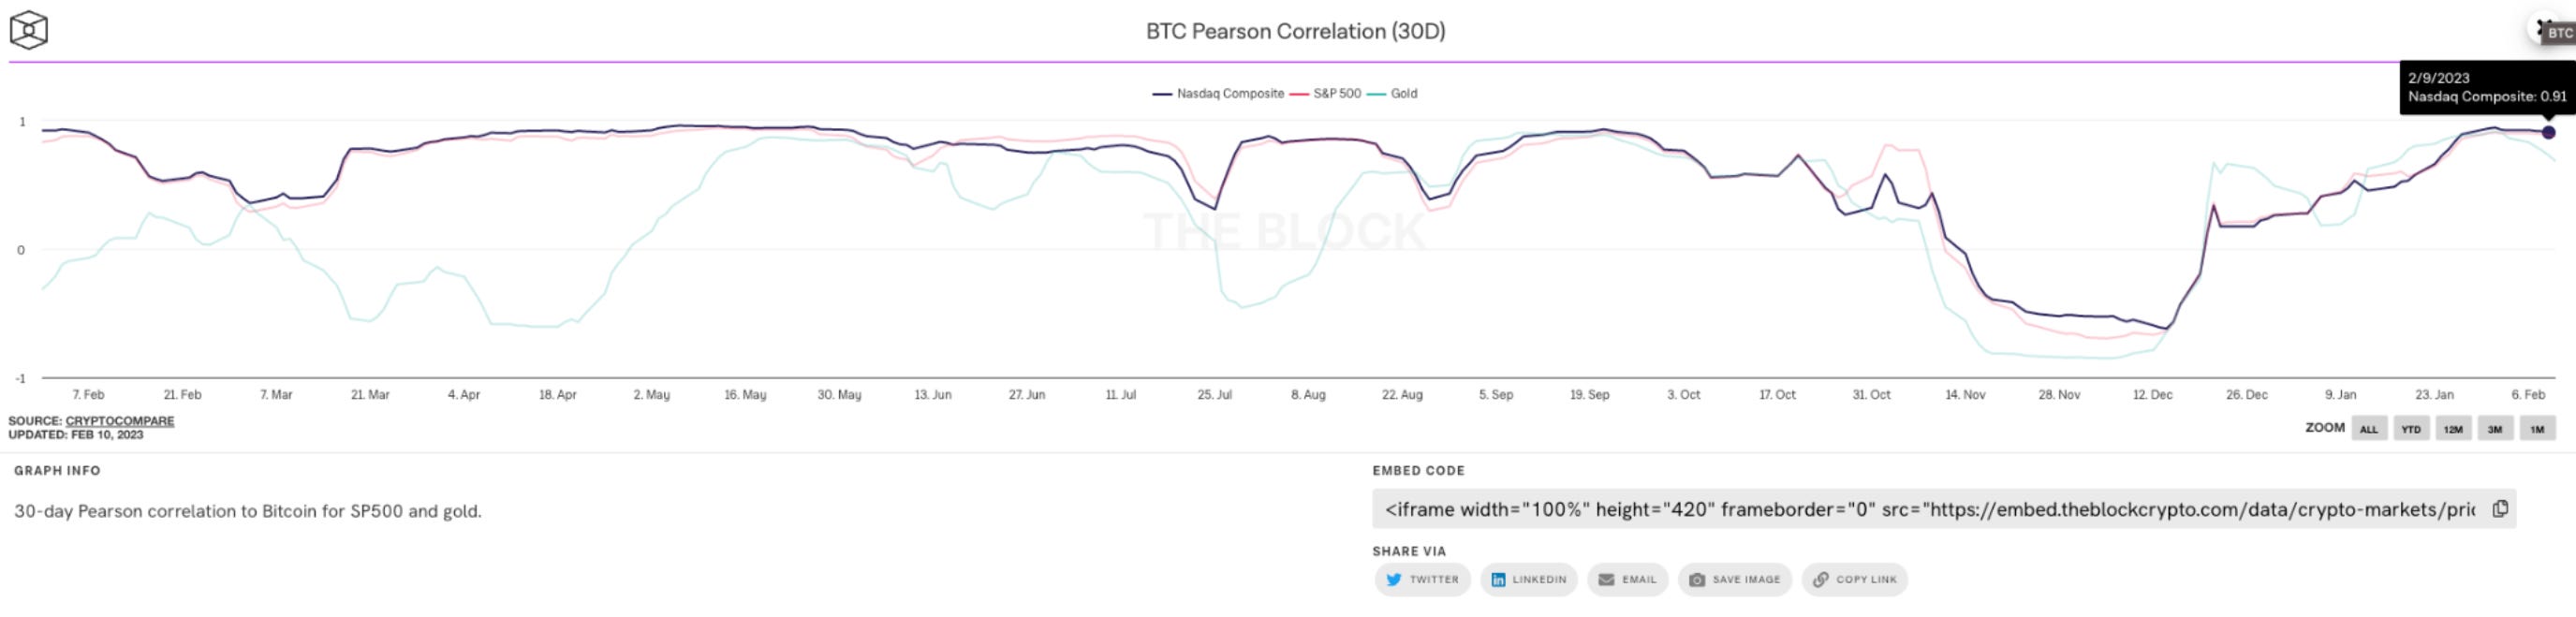
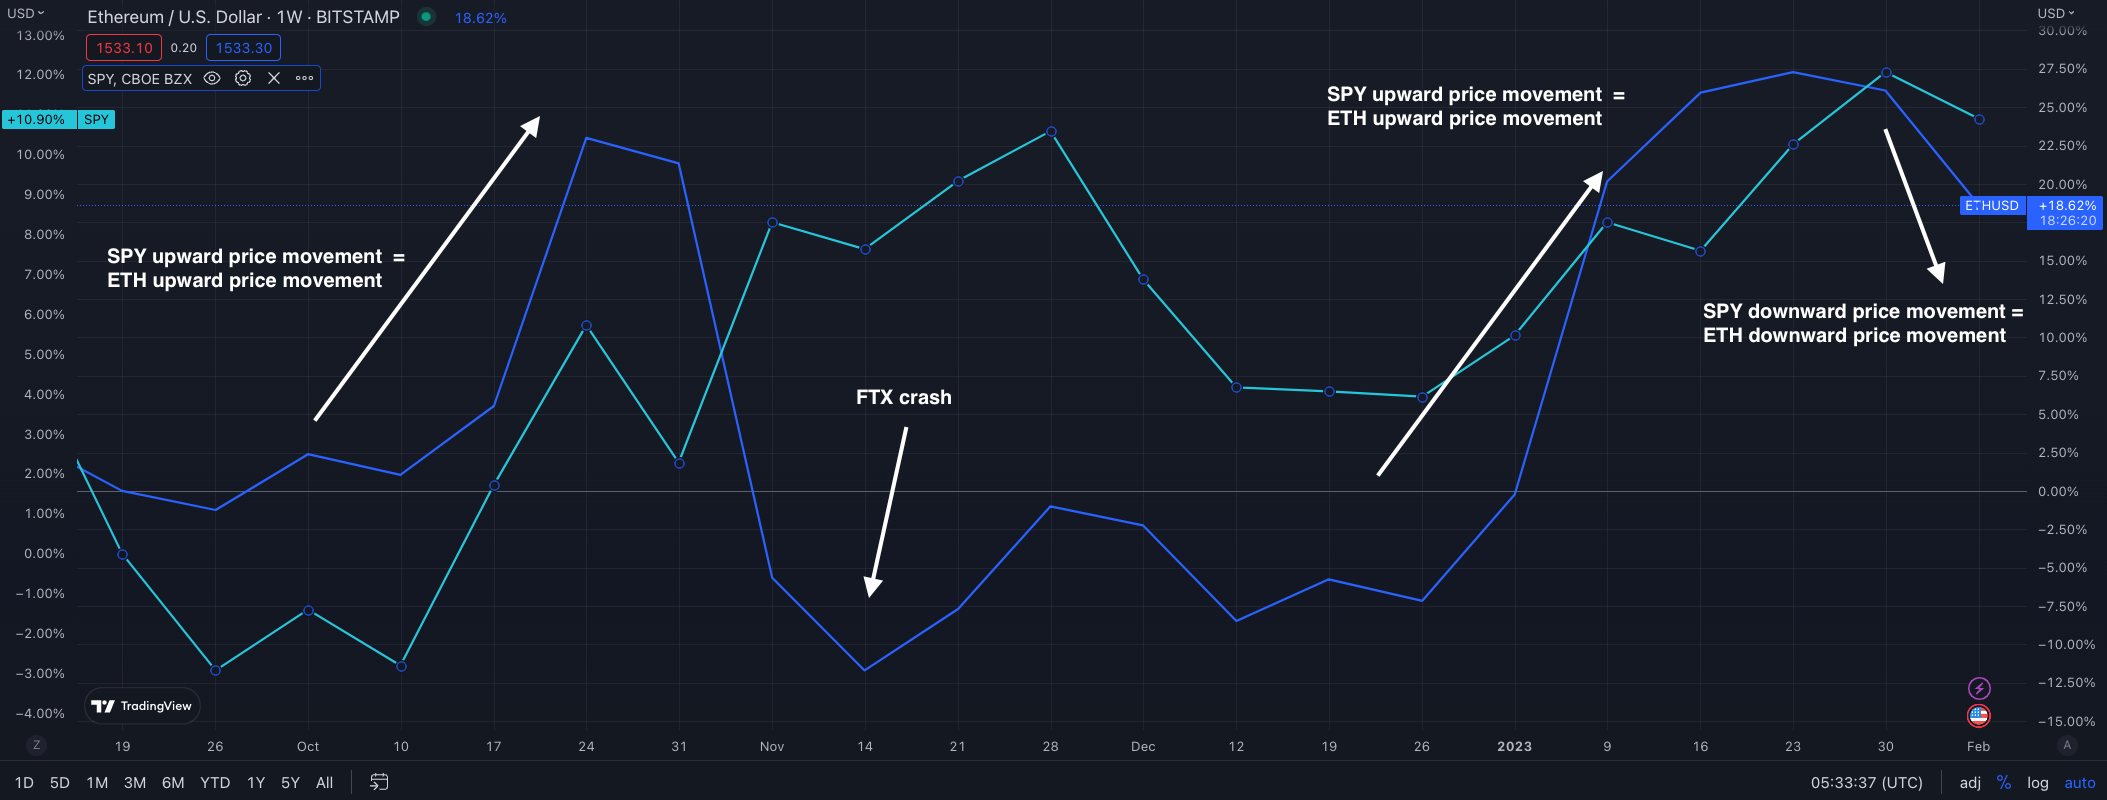
The crypto narrative of Bitcoin as a hedge against fiat currency debasement has largely been proven wrong. Bitcoin is “highly positively correlated” to the price movement of the S&P500 and Nasdaq 100. In the most recent 12 months, the only decoupling occurred in November 2022 when bitcoin performed worse than the broader US equities market due to the FTX collapse.
I also acknowledge that Ethereum is highly positively correlated to the performance of Bitcoin, and barring any major protocol change, you should acknowledge the same.
A positive correlation means that the price of two assets moves together.
A negative correlation means the two assets move inversely of each other.
Uncorrelated pairs mean the price action moves independently of each other.
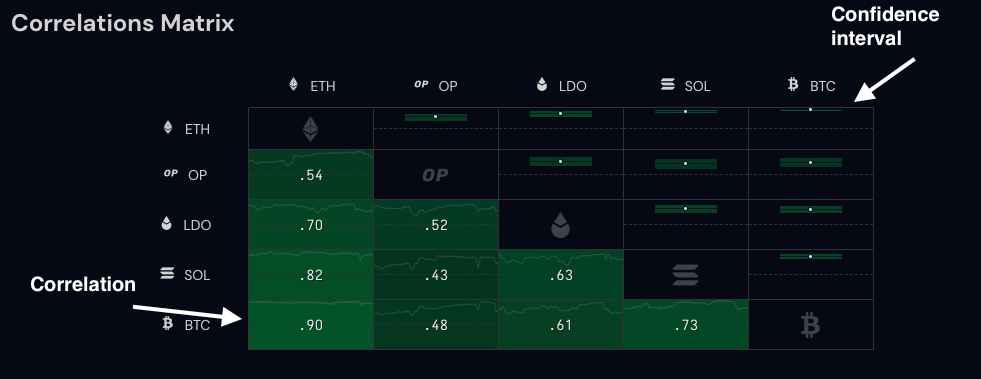
The aforementioned chart ranges from -1 to +1 across the asset pairs. +1 indicates a perfect positive correlation, -1 indicates a perfect negative correlation and 0 indicates no correlation.
The data is saying that the market performance of ETH, SOL, LDO, and OP has a strong positive correlation to the market performance of BTC. Moreover, note the narrow range of the ETH-BTC confidence interval; the correlation matrix states a 95% probability that ETH price action is highly correlated to BTC.
Infact…I will take it a step further and state that, so far, Ethereum’s PoS migration has had zero impact on the price action of ETH the asset. All of the talks around net issuance reduction, elimination of buy/sell pressure, credible neutrality, perma-yield with staking derivatives, and corresponding predictions of ETH to $8,000 or $10,000 by EOY 2022, were all wrong. I took the contrarian point of view and forecasted Ethereum the asset to $1,200 by EOY 2022, and unfortunately, I was correct.
Why? Because as of this writing, ETH price action is highly correlated to the price action of BTC and the broader US equities market.
So what do we do? Do we just say to hell with it and buy SPY or QQQ? Absolutely not.
The aforementioned correlation quantifies the relationship in price movement between SPY and the target crypto asset. It does not measure the depth or nominal movement of the asset itself.
In plain English, if the price of SPY increase by Y%, the price of BTC, ETH, SOL, etc will increase by Y%*[an unknown X]. In the aforementioned table we saw a 7% increase in SPY spot price YTD through 2/3/23, but:
A 40.58% increase in BTC
A 37.02% increase in ETH
A 84.39% increase in SOL
A 223.85% increase in OP
We can conclude that when US equities prices go up by Y%, highly positively correlated crypto assets will increase proportionally by Y%*[unknown X]. This is the alpha. We should not despair and relegate our lives to buying and holding SPY, VIX or QQQ. In the analysis referenced below, I review the price action of BTC/ETH, technical indicators & provide suggestions on how to trade this correlation.

To knowledge and wisdom,
John Cook
February 13, 2023
San Francisco, CA
www.frontruncrypto.com
✍️ Related content:
Article cover generated by DALL-E: “An impressionist oil painting of a libertarian using charts and graphs to explain why crypto is a hedge against fiat currency debasement”