

Calculating Ethereum's implied volatility
Calculating Ethereum's implied volatility
What is implied volatility and how does it help with predicting the future price of Ethereum?

Dear frontrunners,
Crypto-technical analysts point to volatility as an indicator of a potential bottom, but how? Implied volatility (IV) is at a 2-year low. We see BTC at-the-money IV at ~30% vs its May 2021 high of ~150%….
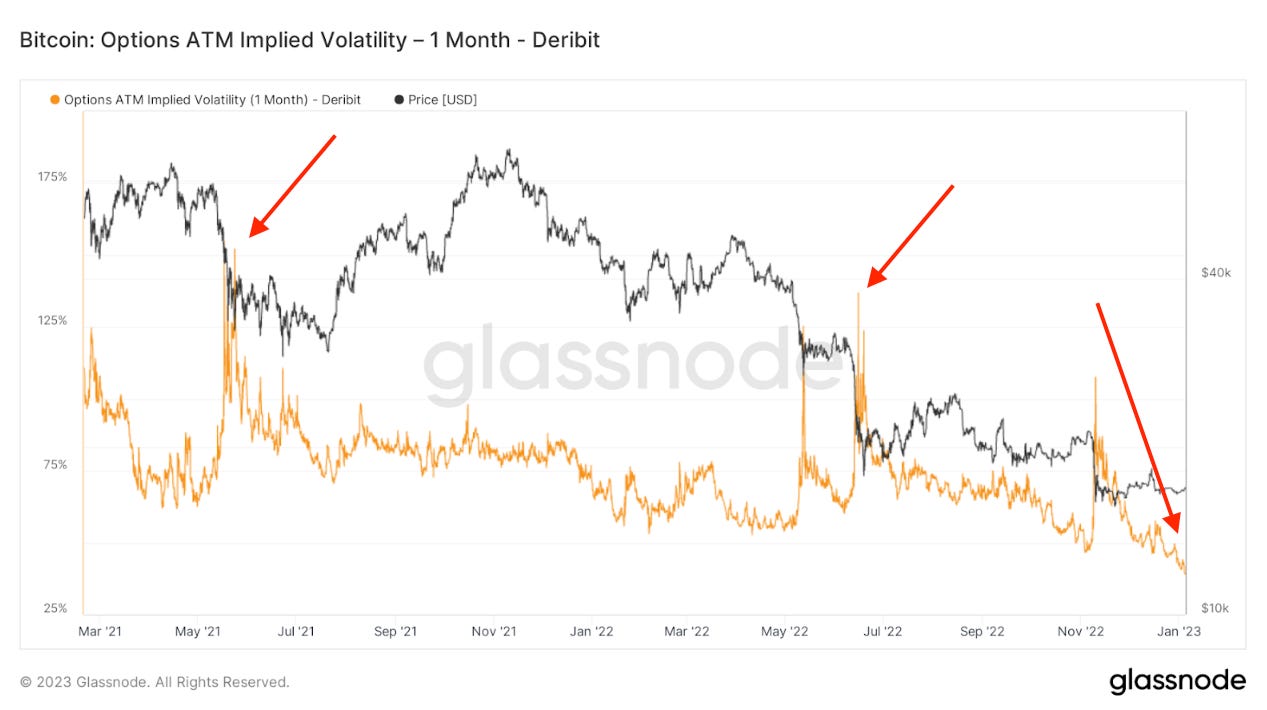
… and Ethereum’s ATM IV at ~62% vs its May 2021 high of ~220%.

But what does this actually mean? How is an IV of 62% “better” than an IV of 220%? Technical analysts like to use IV to measure stability and potential bottoms because it represents the “potential price range of an asset”. More specifically,
IV is expressed as a % of the crypto price
It is the predicted one standard deviation move over a 365-day period
If you don’t remember anything from your statistics class, this means:
Ethereum’s price should end up within one standard deviation of its current spot price 68% of the time in the upcoming 12 months
Ethereum’s price should end up within two standard deviations of its current spot price 95% of the time in the upcoming 12 months
Ethereum’s price should end up within three standard deviations of its current spot price 99% of the time in the upcoming 12 months
Using ETH’s current spot price of $1,500 and IV of ~60% and focusing on one standard deviation of movement, the consensus in the “marketplace” is that there is a 68% chance that at the end of one year ETH the asset will be priced somewhere between $930 and $2,430.
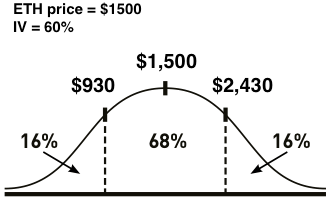
By extension, this also means there is only a 32% chance that ETH will be outside of this range. There is a 16% probability that ETH will be above $2,430 12 months from now, and a 16% probability that ETH will be below $930 12 months from now.
Technical analysts point to knowing the probability of an underlying asset within a certain range as an important indicator when determining what options to buy or sell.
When the IV on ETH was 220% on 5/21, its spot price was $4,100. This implies that the market believes with 68% confidence that ETH will trade between an upper bound of $13,120 and a lower bound of -$4,920. Not so useful right? At best we can extrapolate at times of peak volatility, marketplace consensus is uncertain.
To knowledge and wisdom,
John Cook
February 4th, 2023
San Francisco, CA
www.frontruncrypto.com
Article cover generated by DALL-E: “A Van Gogh style painting of mathematicians using an abacus to predict the future price of Ethereum”
